The benefits of control-based and data-driven energy efficiency strategies can be quantified in many ways. Optimizing performance, reducing CO2 emissions, and decreasing energy demand are all positive outcomes of utilizing a smart energy system, but how can you measure a project’s return on investment? Cost savings is key to validating efficiency efforts, and when executed with a measurable and justifiable goal in mind, tracking this metric correctly can prove that many efficiency projects – like implementing GridPoint’s Smart Building platform – pay for themselves; making it a sound financial investment for your business.
What method does GridPoint use to track energy savings?
The International Performance Measurement and Verification Protocol (IPMVP) Standard Option C (Whole Facility) is an industry-standard practice for computing whole-building energy savings. GridPoint utilizes this standard, as do other leaders in the marketplace, including the National Renewable Energy Laboratory, the U.S. Department of Energy, and the Association of Energy Engineers to name a few. This standard requires current best practice techniques in verifying energy efficiency projects, assessing improvements, and tracking modification of operating procedures.
What is the IPMVP Option C model based on?
Regression analysis is the essence of calculating energy savings with the IPMVP Option C model.
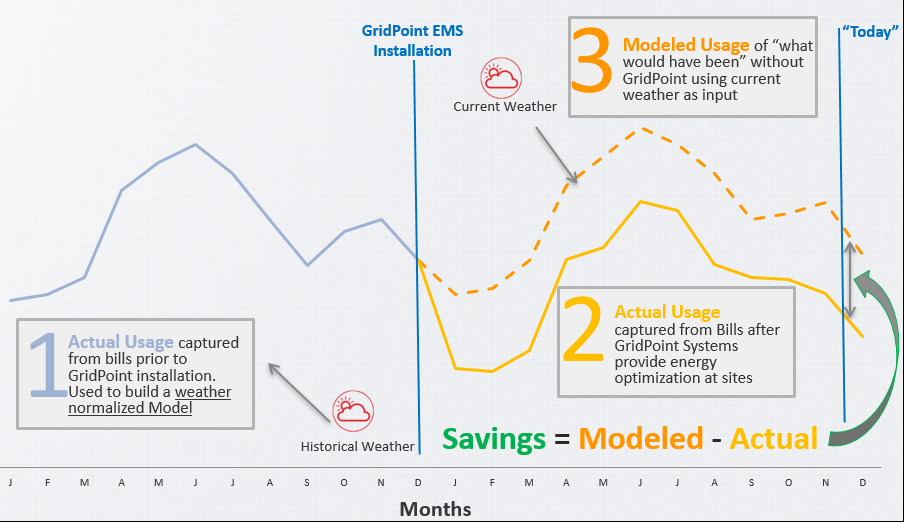
1. Creating a baseline for energy usage – At least 12 months of utility data preceding any change intended to improve operational efficiency concerning energy consumption, such as GridPoint’s Energy Management System, is collected and used as an established baseline. This data sets the stage for how the building used energy before the EMS was installed. Weather data (HDD and CDD) during the baseline period is then aligned with energy consumption data from the utility to create a correlation. This relationship represents how the building’s energy load will respond as weather changes. For more information on this topic, see our post on Weather Normalization.
2. Building a predictive model with energy usage and weather – Once the relationship between weather and energy consumption is established, a prediction on how the building will respond to weather in the future can be calculated. This is called “modeled usage” based on linear regression of energy consumption and degree days. Below is a formula for computing modeled usage with baseline load and weather factors:
(HDD factor*HDD) + (CDD factor*CDD) + Baseline Load = Modeled Usage
3. Comparing modeled usage to actual usage – After the EMS installation, modeled usage (what the building would have used without EMS) is compared to the actual usage (what the building used with EMS) to arrive at energy consumption savings.
By leveraging industry-proven techniques, GridPoint delivers accurate savings results and enables customers to meet their specific energy management goals. Through recurring performance reviews with GridPoint’s Energy Advisory Services team, additional energy conservation opportunities may be discovered, keeping your business on track for important milestones ahead.