Unless you live in an area with moderate weather, you probably remember years with random heat waves in March and other years when a blizzard struck in the same month. Because weather can vary so drastically with time, it can be difficult to determine how a building performed this year compared to last year; simply comparing March 2018 to March 2017 would not provide an accurate story of building performance over that year. To track building performance, savings, and energy efficiency investments, facility professionals must normalize their data to understand weather impact before analyzing consumption.
What is Weather Normalization?
EnergySTAR defines weather-normalized energy as the energy your property would have used if you had experienced 30-year average temperatures. It’s a method of smoothing the influence of ambient conditions to identify how a building uses energy over time, enabling an apples-to-apples assessment of energy consumption.
Weather influence is measured in Heating Degree Days (HDD) and Cooling Degree Days (CDD). Higher HDD or CDD values represent the greater need for heating or cooling, respectively, to keep a building conditioned and comfortable. Figure 1 below demonstrates how kWh and Degree Days are plotted to understand their relationship. From here, we can determine that when the building experienced 20 HDD, the site used 100 kWh.
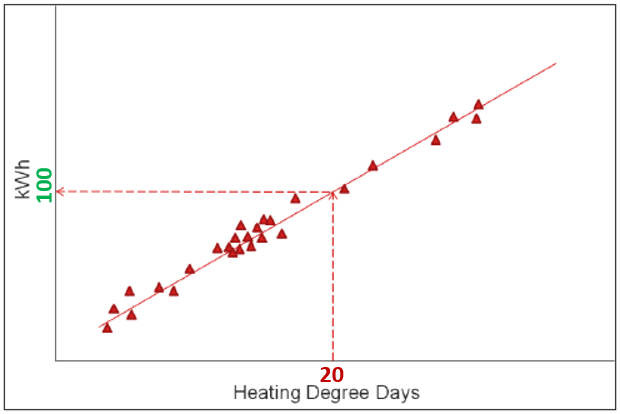
Figure 1 – shows the relationship between energy consumption (in kWh) and Degree Days
In Table 1 below, let’s compare Year 1 to the Baseline Year. Without taking weather into account, we would surmise that the building consumed 13% more energy in Year 1 (45,840 kWh) than in the Baseline Year (40,480 kWh). However, such an assumption would not represent an accurate view of the building’s performance. Notice that the HDD in Year 1 (681 HDD) was much higher than it was in the Baseline Year (520 HDD). This indicates that the Baseline Year weather was milder than Year 1 weather, so less energy was required to keep the building conditioned in the Baseline Year. The “kWh per HDD” column represents the weather-normalized energy consumption. Comparing the “kWh per HDD” for the 2 years shows us that the building consumed 14% less energy in Year 1 (67 kWh/HDD) than in the Baseline Year (78 kWh/HDD).
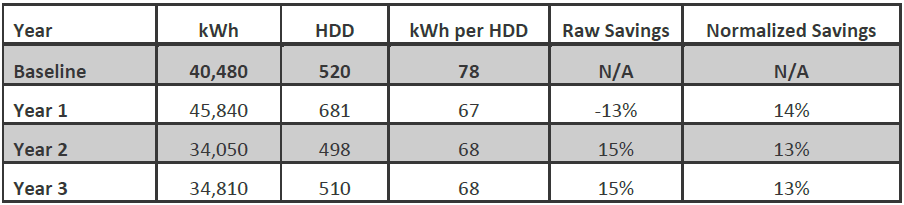
Table 1 – Year-over-year energy consumption and HDD comparison for example building
GridPoint uses the industry-trusted best practice for calculating energy savings using weather-normalized data: The International Performance, Measurement, and Verification Protocol (IPMVP) Option C: Whole Building. This methodology aligns energy consumption with HDD and CDD in a linear regression model to provide the most accurate portrayal of building performance over time. Weather Normalization is a shining example of how GridPoint leverages powerful analytics and vast marketplace knowledge to provide reliable, actionable data across several verticals.
In my experience as a data analyst, I have noticed cases where degree day trends remained comparable from year to year, but energy trends changed significantly. In other words, the building was using more energy to condition zones, but weather trends showed little change. Situations like this often indicate equipment issues and make a strong case for regular preventative maintenance, such as cleaning condenser coils or replacing filters.
In short, degree days affect your business by influencing energy consumption trends. An influx in heating degree days or cooling degree days, in events such as blizzards or heat waves mentioned earlier, can cause an unexpected shift in energy consumption. Weather normalization helps by controlling those independent variables and enables you to zoom in on specific behavior to identify equipment issues, operational changes, or other unnecessary energy consumption expenditures.

Jack French | Senior Manager, Energy Analytics
Jack French holds a leadership role at Gridpoint developing the Site Acceptance and Proactive Monitoring teams. His experience spans multiple disciplines including data validation, advanced analytics, measurement & verification, customer engagement, and control optimization.